

Average Read Time: 11–13 minutes.
From Premiums to Patient Care“Only 85¢ of every premium dollar goes to actual care,” but where does the rest go, and why should you care as a clinician?
When your patient writes that monthly premium check for $450, where exactly does that money end up? Understanding this financial journey isn’t just academic curiosity—it directly impacts your practice’s reimbursement rates, explains common coverage decisions, and provides crucial context for healthcare policy debates affecting your daily work.
Let’s trace a premium dollar from your patient’s bank account to the moment it pays for their care, uncovering the complex financial machinery that powers American healthcare.
The Premium Dollar: First Stop – Insurance Company Collections
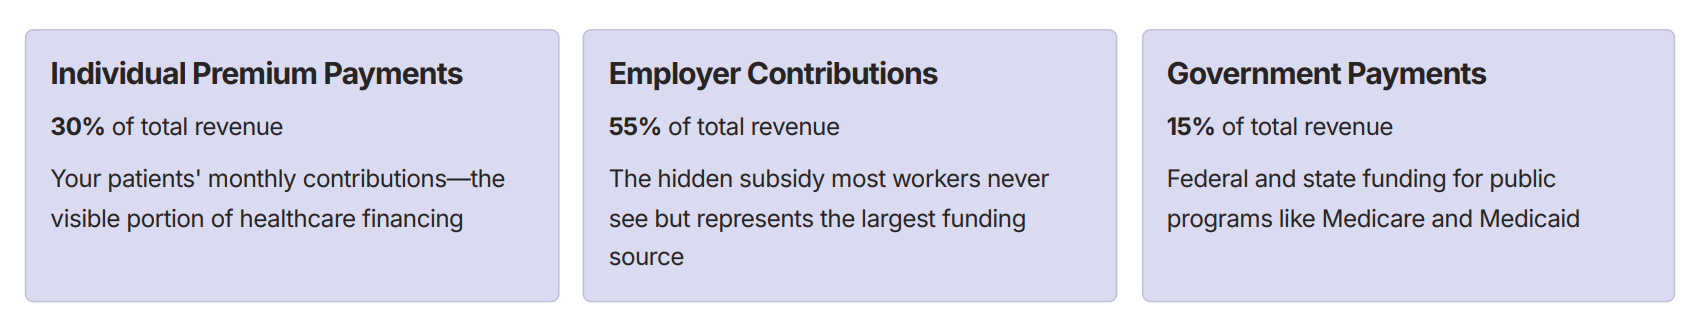
Every month, approximately $1.2 trillion flows into health insurance companies across America.¹ This massive sum comes from three primary sources:
- Individual Premium Payments (30%): Your patients’ monthly contributions
- Employer Contributions (55%): The hidden subsidy most workers never see
- Government Payments (15%): Federal and state funding for public programs
But here’s the first surprise: Not all of this money reaches patient care.

The Medical Loss Ratio: Healthcare’s Most Important Rule
Federal law requires insurance companies to spend at least 80-85% of premium revenue on actual medical care — a regulation called the Medical Loss Ratio (MLR). This critical rule shapes how every healthcare dollar flows through the system.
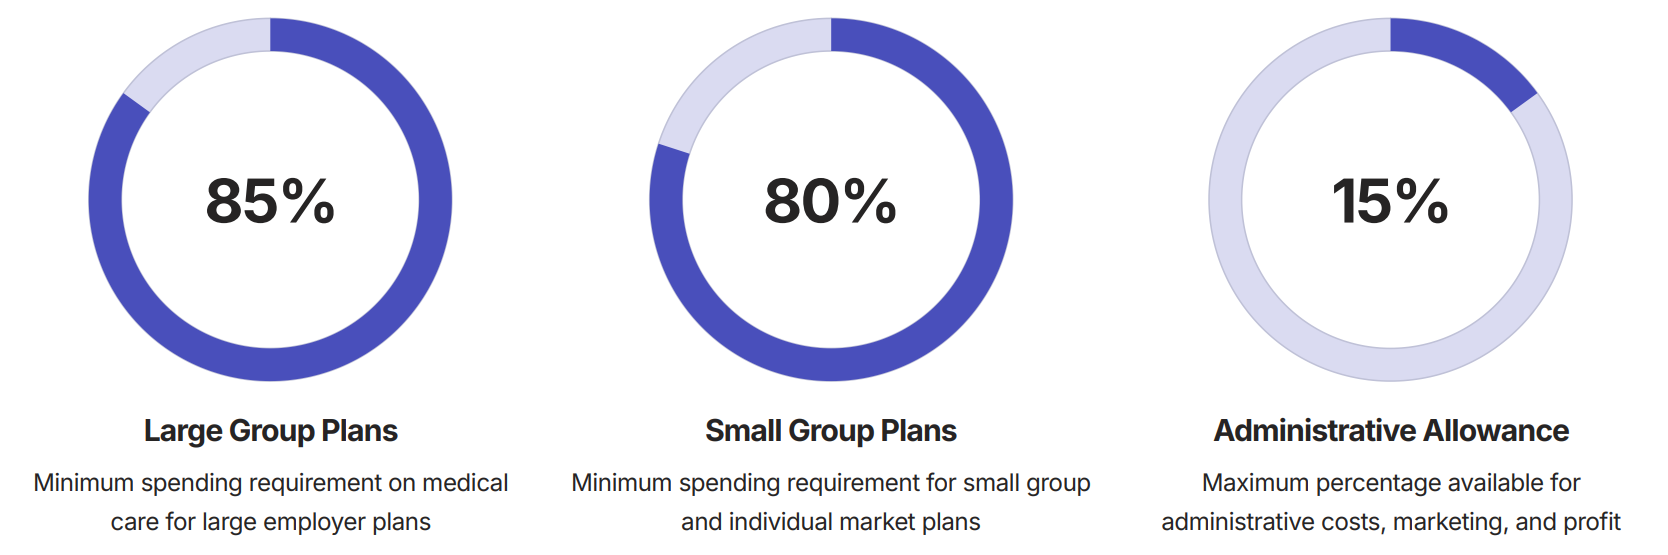
When insurers exceed these profit margins, they must rebate excess funds directly to policyholders — creating a built-in mechanism to ensure premium dollars flow toward patient care rather than corporate profits.
Where the Remaining 15–20% Goes
Understanding how insurance companies use their administrative allowance reveals the hidden costs of healthcare financing that directly impact your practice operations.
Administrative Costs (8–12%)
- Claims processing and customer service
- Provider network management
- Utilization review and prior authorization
- Information technology systems
Marketing and Sales (2–4%)
- Broker commissions and advertising
- Enrollment and retention programs
- Market research and product development
Regulatory Compliance (1–2%)
- State insurance department requirements
- Federal reporting obligations
- Legal and compliance staff
Profit Margins (3–5%)
- Shareholder returns for publicly traded insurers
- Capital reserves for unexpected losses
- Investment in infrastructure improvements

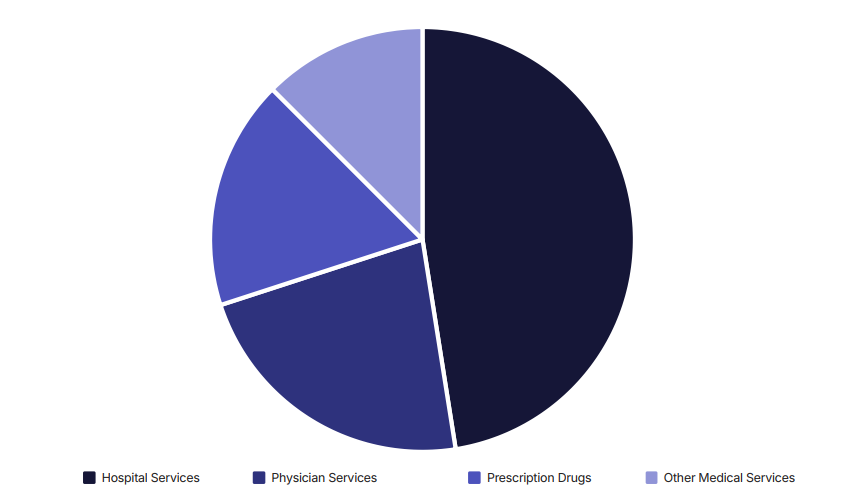
The Medical Care Dollar: How Your 85¢ Gets Distributed
Once that premium dollar passes the MLR requirement, it enters the actual healthcare delivery system. Understanding this distribution helps explain reimbursement patterns and coverage decisions affecting your practice.
| Category | Details |
|---|---|
| Hospital Services (45–50%) |
|
| Physician Services (20–25%) |
|
Geographic Variations: Why Location Affects Your Reimbursement
Healthcare spending varies dramatically by region, directly impacting your practice’s financial dynamics and explaining why identical services may have vastly different reimbursement rates.
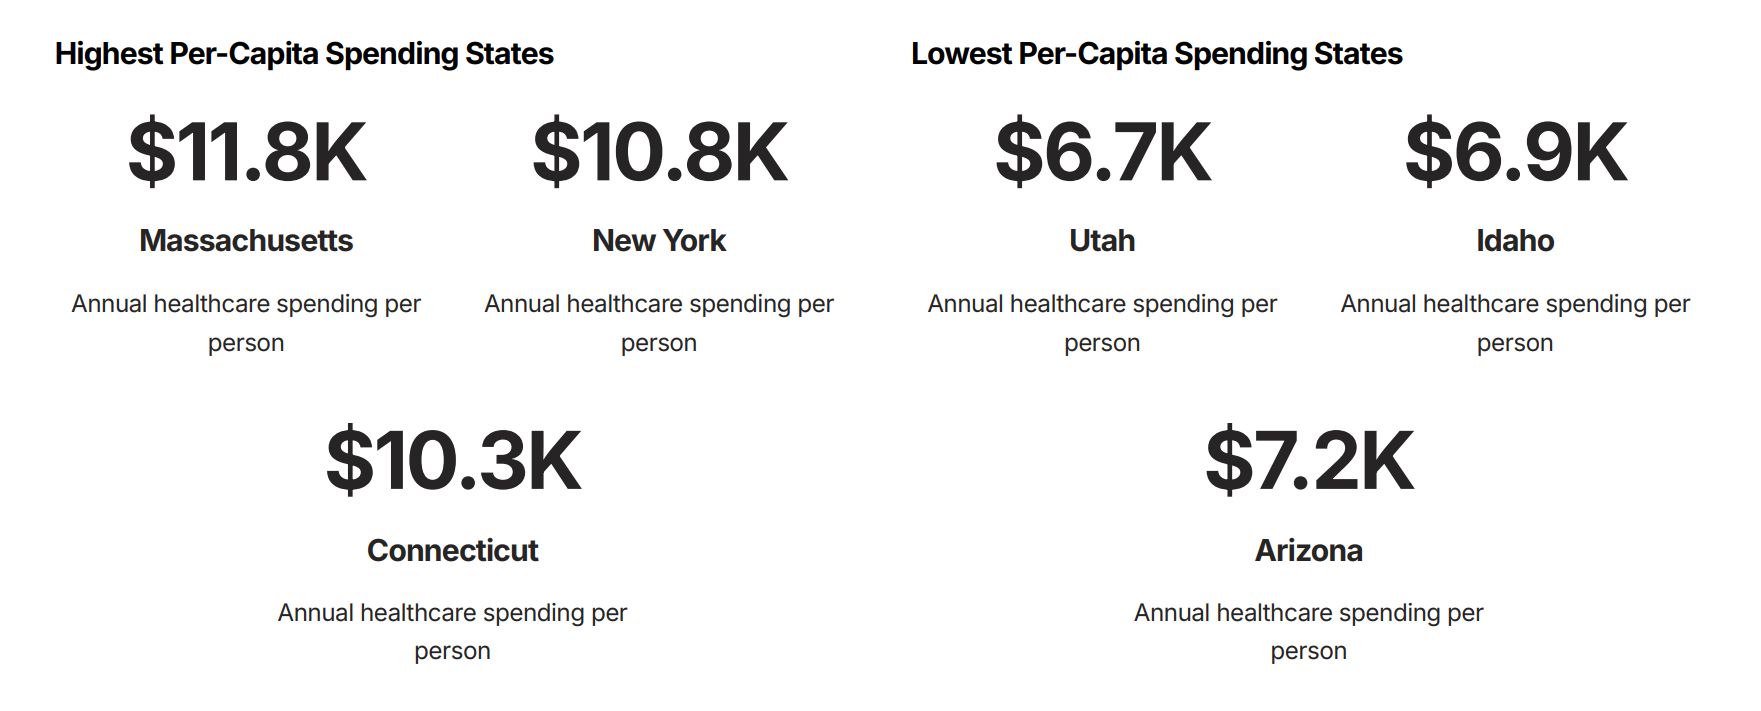
These variations reflect differences in cost of living, provider supply and competition, state insurance regulations, and population health characteristics — all factors that directly influence your practice’s revenue potential.
The Prior Authorization Tax: Administrative Costs in Action
When you encounter prior authorization requirements, you’re witnessing the administrative portion of premium dollars at work. This system represents a classic tension between cost control and clinical efficiency.
- Provider Time Cost: 16 hours per week per physician spent on prior authorization activities
- Administrative Staff Impact: 2.3 hours per authorization request for support staff
- System-Wide Cost: $31 billion annually in administrative overhead costs
Yet insurers argue these controls save more money than they cost by preventing inappropriate utilization — a classic example of the tension between administrative efficiency and clinical autonomy.
Understanding this dynamic helps explain why streamlining prior authorization processes has become a major focus of healthcare policy reform efforts.

Value-Based Care: Changing the Money Flow
Traditional fee-for-service payment flows money based on volume — more procedures equal more revenue. Value-based payment models are fundamentally reshaping this relationship, creating new financial incentives that align with patient outcomes.
Accountable Care Organizations (ACOs)
Providers receive shared savings when they reduce costs while maintaining quality metrics, redirecting money from procedure volume to population health outcomes.
Bundled Payments
Single payments cover entire episodes of care, requiring providers to manage resources efficiently across the full treatment cycle.
Capitation Models
Fixed per-member payments shift financial risk to providers, incentivizing preventive care and chronic disease management.
These models represent a fundamental shift from paying for healthcare services to paying for healthcare outcomes — a change that requires new approaches to practice management and patient care coordination.
The Specialty Care Premium and Emergency Care Costs
Understanding reimbursement differentials across care settings helps explain coverage policies and referral patterns that affect your daily practice decisions.
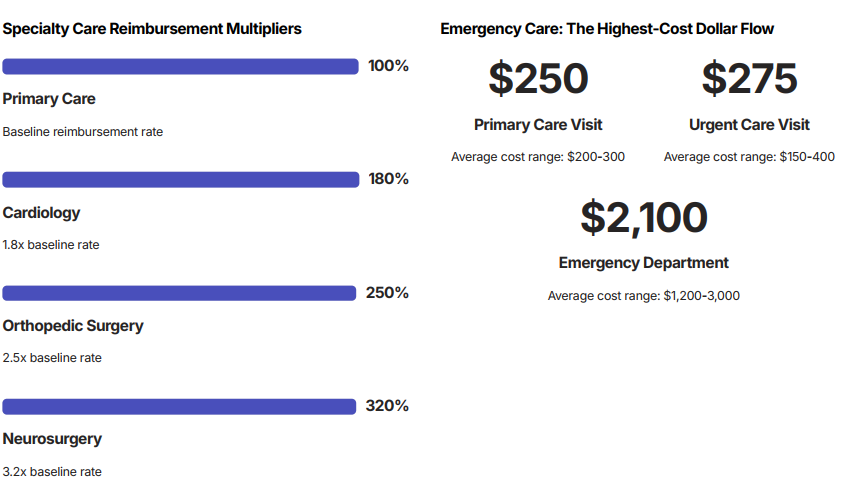
These cost differentials explain insurance companies’ emphasis on care coordination and their willingness to pay for urgent care centers and retail clinics as emergency department alternatives.
The Bottom Line: Why Money Flow Matters for Your Practice
Every healthcare dollar faces competing demands — administrative efficiency, clinical quality, innovation investment, and profit margins. Understanding these trade-offs positions you for success in an evolving healthcare landscape.
As healthcare continues evolving toward value-based payment models, clinicians who understand money flows will be better positioned to thrive while delivering excellent patient care.
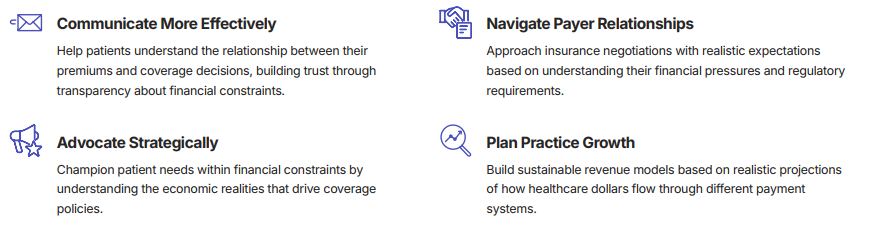
How do you help patients understand the relationship between their premiums and their care coverage?
What strategies have you found effective for managing the financial aspects of clinical decision-making? Share your experiences to help colleagues navigate these complex financial dynamics.
References
¹ National Association of Insurance Commissioners. “Health Insurance Premium Revenue Analysis.” 2024.
² Centers for Medicare & Medicaid Services. “Medical Loss Ratio Requirements and Rebates.” Federal Register, 2023.
³ Centers for Medicare & Medicaid Services. “National Health Expenditure Data: Historical.” 2024.
t Kaiser Family Foundation. “Health Care Expenditures per Capita by State.” State Health Facts, 2024.
u American Medical Association. “Prior Authorization Physician Survey.” Practice Management Report, 2023.
v Medical Group Management Association. “Physician Compensation and Production Survey.” 2024.
w Health Care Cost Institute. “Emergency Department Visit Costs by Setting.” Healthcare Cost Report, 2023.
x American Hospital Association. “Uncompensated Hospital Care Cost Fact Sheet.” 2024.